ChibiStudio Overview
Introduction
The first time using ChibiStudio can be intimidating for a new user due to a large number of buttons and windows. This article aims to provide a general overview of ChibiStudio as a tool and its overall structure, in order to make it easier for the user to navigate and understand how it can improve their workflow.
What is ChibiStudio
ChibiStudio is a development environment for ChibiOS/RT, a free and open-source real-time operating system (RTOS). It is based on Eclipse and includes the ChibiOS distribution, tools such as the GCC toolchain for ARM and OpenOCD, and provides a preconfigured environment for developing, debugging and deploying applications.
It simplifies the process of developing on ChibiOS/RT by providing a user-friendly interface and allows developers to focus on their application development rather than configuring the environment.
As it is based on Eclipse, many of the concepts in ChibiStudio are inherited from Eclipse architecture, but this article aims to highlight the most important points.
TReaders who wish to delve deeper into the topic can refer to the Eclipse documentation.
Workbench and Workspace
ChibiStudio is structured into Workbenches, which can be thought of as the main window. Each workbench functions as a “bench” where various programming tools are organized, such as views and editors. These are the individual tools that you can use to navigate, edit and debug code. They can be opened and closed as needed and can be placed anywhere on the workbench as required.
All the settings, variables, perspectives, history, and imported projects related to the workbench are saved as metadata in a location called the Workspace. The Workspace is a designated area on your computer where Eclipse stores all the configuration information for your development environment.
By default, the fresh ChibiStudio installation comes with several workspaces: a trunk workspace (located under [ChibiStudio Root]\workspace_trunk), a user workspace (located under [ChibiStudio Root]\workspace_user) and several workspaces corresponding to various ChibiOS releases that are coming with ChibiStudio as well as workspaces where different demo project from PLAY Embedded can be found. The user workspace is the default workspace allocated to new users, but additional workspaces can be created at any time to better organize one’s work.
A key takeaway before moving further:
The workspace is an actual directory on the file system accessible via Explorer, while workbenches are part of the GUI of ChibiStudio and can only be interacted with while actively using the software.
Current workspace
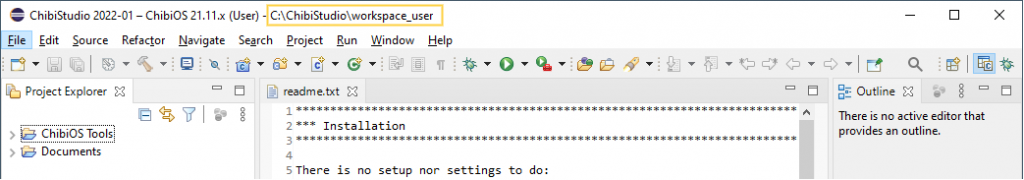
As ChibiStudio comes with many workspaces, it is important to understand how to recognize the current workspace. This can be done by looking at the top name bar of Eclipse: it includes information such as the version of ChibiStudio, the version of ChibiOS being used in that workspace, and the path of the workspace.
If we open this path in the file explorer, we will notice that a workspace is simply a folder that contains projects and a subfolder named “.metadata” that holds all the settings and information needed by Eclipse.
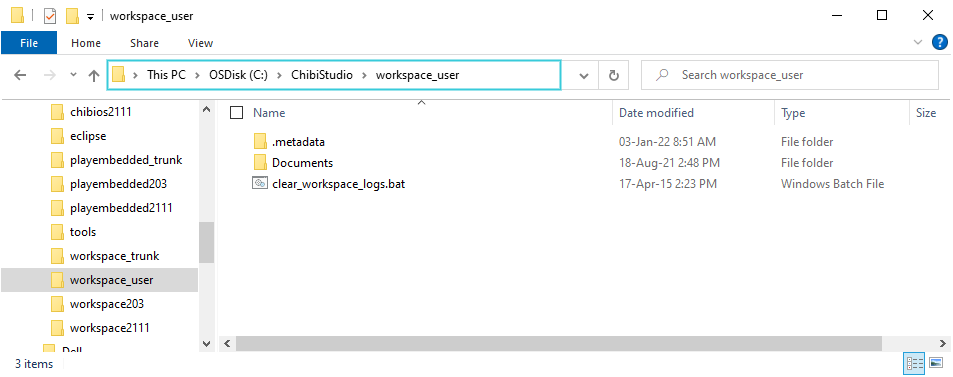
When creating new projects by duplicating the default one, they will be located here. This is the folder that you may want to back up if you decide to update to a new version of ChibiStudio or switch computers.
Switching between workspaces
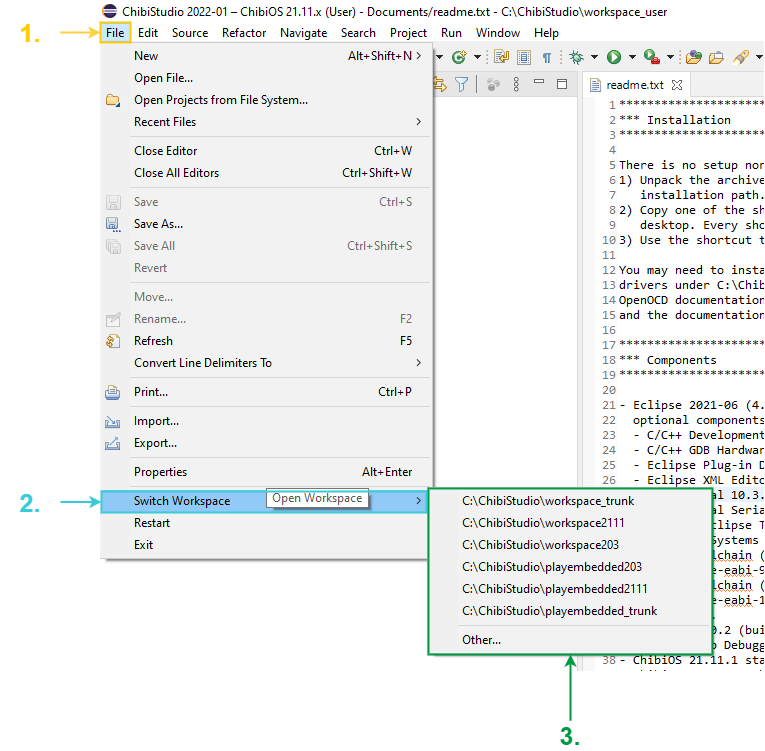
Switching between workspaces in ChibiStudio can be useful when working on multiple projects or configurations. It allows you to easily switch between different projects or configurations without having to manually close and open different instances of the software. The process for switching between workspaces in ChibiStudio is relatively straightforward and can be done by following these steps:
- Go to File
- Select Switch workspace
- Choose one of the folders from the existing list or navigate to a custom location via Other…
ChibiStudio will close the current workspace and open the selected one. It’s also worth noting that it is good practice to back up the workspace folder, to avoid losing any important work or configurations.
Perspectives
The workbench organization in ChibiStudio can be set, saved and recalled at any time to better assist and optimize the development flow. These setups are known as perspectives. A perspective is a layout of views and editors that is tailored to specific tasks and activities. For example, in ChibiStudio, there is a “Debug” perspective that includes views and tools that are relevant for debugging.
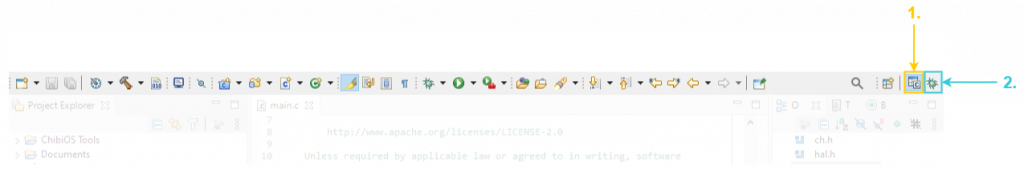
Perspectives can be switched using the button located in the top right corner of the Workbench, as highlighted in the figure below. It is also possible to add other perspectives, save or reset the current one to default through the drop-down menu “Window” located in the menu bar. Note that switching perspectives is a matter of organizing one’s view and will not have any impact on the code or files. You can switch perspectives as needed or desired without any concern.
The default perspectives that are available at first launch are:
- C/C++– designed to facilitate code development
- Debug– which provides quick and easy access to the most used debugging tools
The two perspectives reflect the way in which the code development process is split. Code editing is only a phase of the whole development process and having successfully compiled code is not enough for a project to be deemed successful. Therefore the development process could be split into two specific parts, corresponding to the two default perspectives.
C/C++ Perspective
The software development process encompasses a wide range of tasks, including creating new projects, editing code, compiling, and resolving errors and warnings. The C/C++ Perspective in ChibiStudio provides a specialized layout of views and tools that are specifically designed to assist with these tasks. The majority of the screen is dedicated to the code editor, as it is a crucial component for writing and editing code. This perspective is optimized to streamline the development process and make it as efficient and effective as possible.
Windows overview
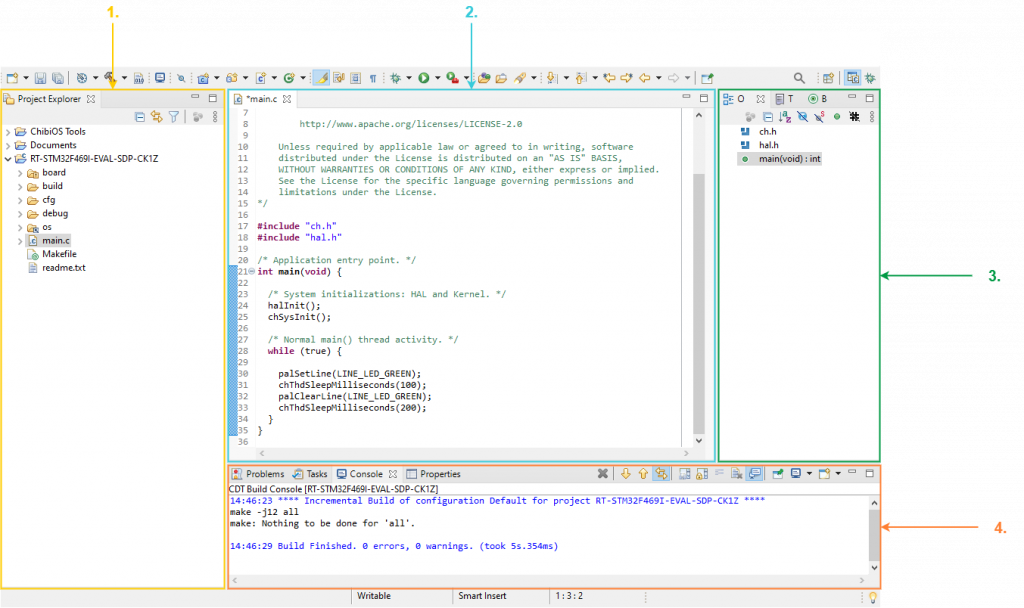
The following figure highlights the visible windows from the C/C++ Perspective of ChibiStudio:
- The Project Explorer, located on the left side of the screen, displays all the projects belonging to the currently active workspace, whether they are open or closed. It also allows for easy navigation within an open project’s folders and files. It’s worth noting that the Project Explorer is populated by two dummy projects by default, ChibiOS Tools and Documents, which contain the documentation and tools used by ChibiStudio and should always be present and opened in the workspace.
- The Text Editor, occupying the majority of the center screen, is where the actual code writing and editing are done.
- The Outline, located on the right side of the screen, provides a blueprint of the structure of the files that are open in the editor area.
- At the bottom of the screen, multiple tabs such as Console or Problems provide information about the build process and highlight syntax warnings and errors as a result. These tools play a crucial role in code syntax validation and help developers quickly identify and fix any issues with their code
Ribbon bar – basic buttons
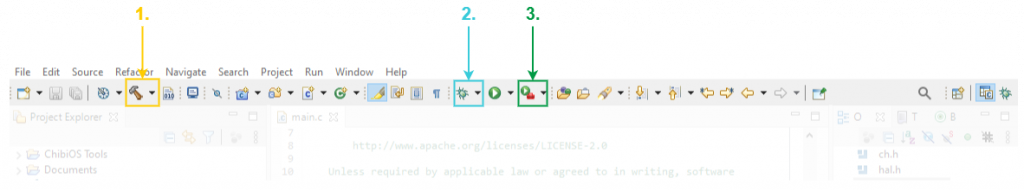
The figure below highlights some of the basic and most commonly used buttons in the C/C++ perspective ribbon of ChibiStudio:
- The Build button is used to compile the code before it is run.
- The Debug button is useful for testing and deploying the project on a platform. The debug options, also known as Launch Configurations, can be accessed by clicking the black arrow on the right side of the button.
- The External Tools button provides a variety of functionalities necessary before flashing and running the project on a platform. These functionalities can be accessed by clicking the downward-facing black arrow on the right side of the button, instead of clicking the button directly.
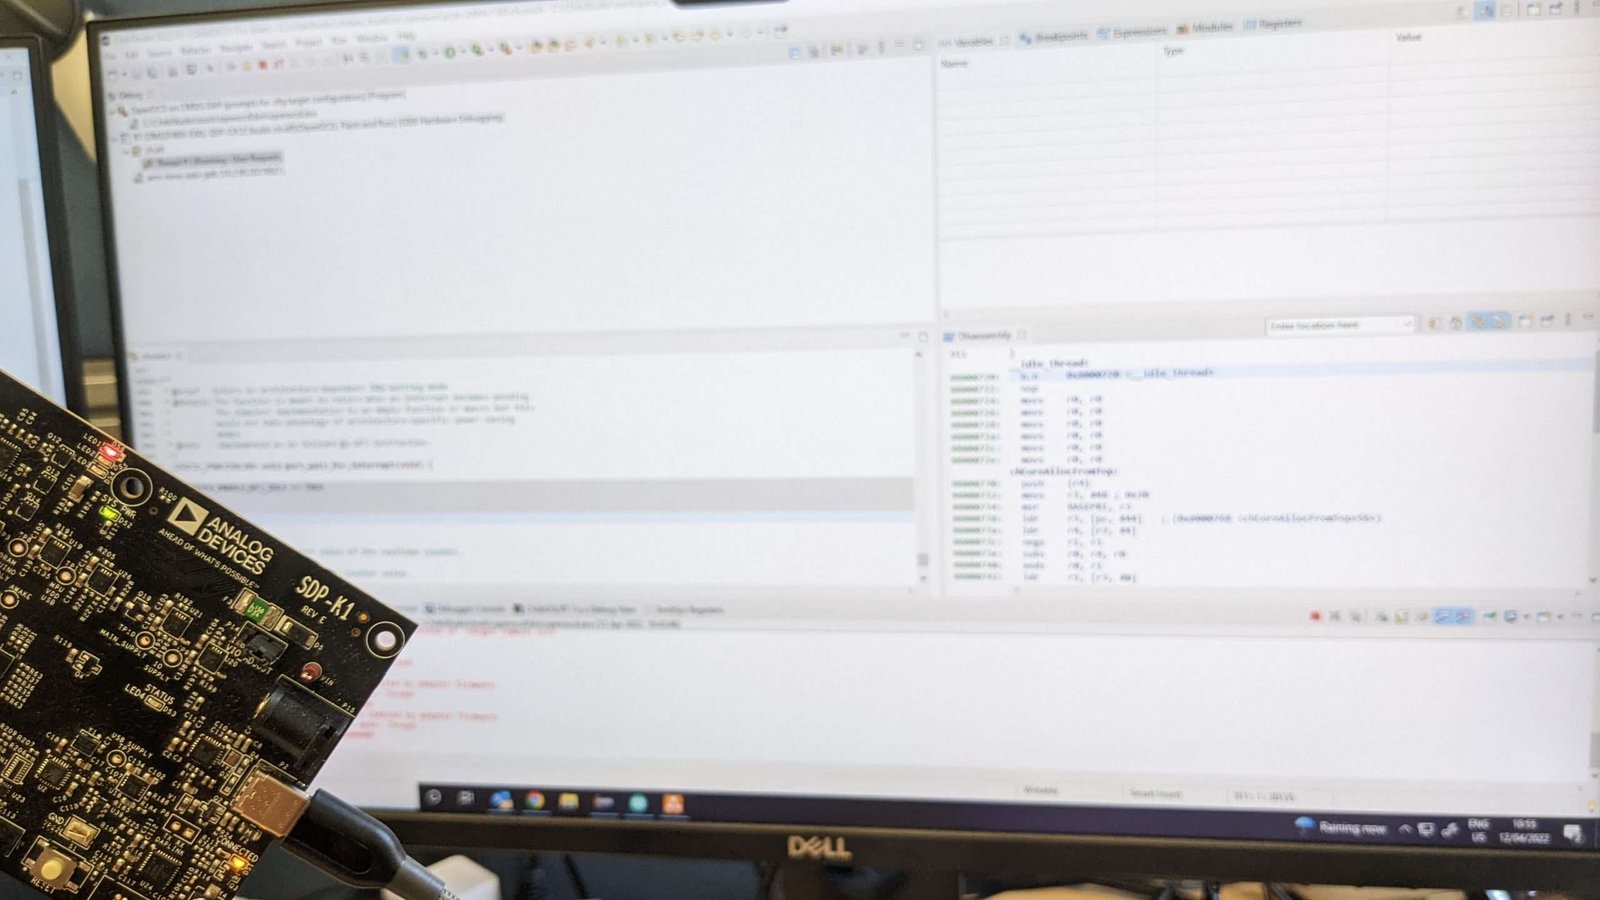
Debug Perspective
Debugging is an essential step in the software development process that involves testing code functionality, identifying unexpected behavior, and evaluating software performance and consistency. The Debug Perspective in ChibiStudio is specifically designed to support these tasks and provides additional windows and tools to explore code, memory, and variables, evaluate expressions, connect to a terminal, and much more. This section provides an overview of the perspective and some of its most commonly used functionalities. For more detailed information on how to debug in ChibiStudio, please refer to the accompanying article.
Windows overview
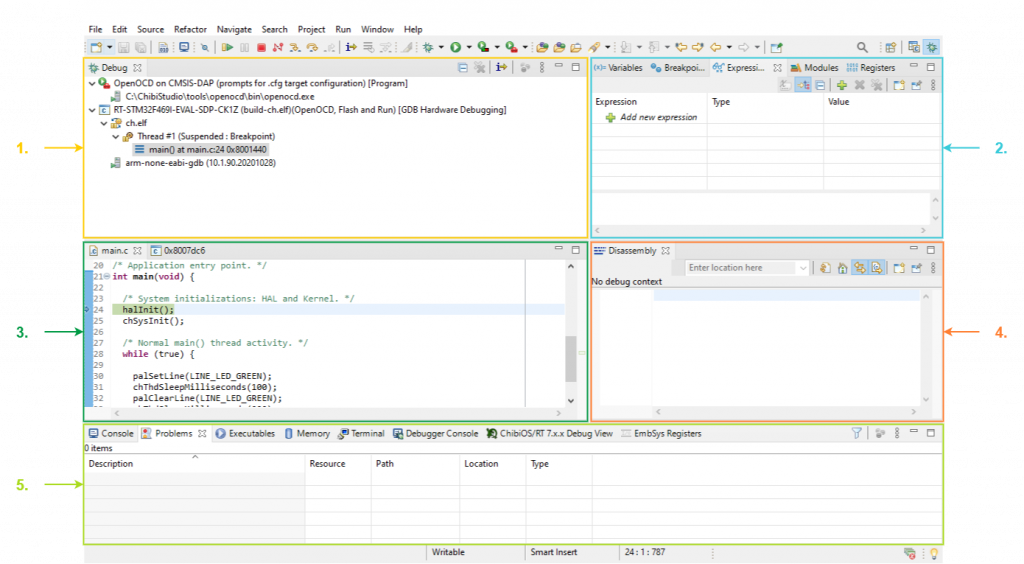
The figure below highlights the visible windows in the Debug Perspective of ChibiStudio:
- The Debug window, located in the upper left corner of the screen, is where the currently active execution session can be tracked.
- The upper right corner of the screen features multiple tabs, each providing a unique utility for debugging code. Some of the most commonly used tabs include:
- The Variables window, which displays the variables that are part of the current function.
- The Breakpoints window, which shows existing breakpoints in the code.
- The Expressions window, where custom expressions can be written and analyzed.
- The Registers window, which displays the registers of the central processing unit (CPU).
- The Text Editor window, located on the left side of the screen, has the same functionality as in the C/C++ Perspective.
- The Disassembly window, provides more advanced functionality for tracking code execution in more detail.
- The bottom of the screen features multiple tabs that provide access to additional helpful features. Some of the most commonly used tabs include:
- The Console view, which can display the output of utilities invoked when building a project or the programs’ output when running or debugging.
- The Terminal window, which allows access to a terminal.
- The Problems view, which shows problems that occur during code execution.
- The EmbSys Registers window, which displays the peripheral registers. This should not be confused with the registers on the CPU, which were addressed earlier.
- The Memory window allows to explore and examine the microcontroller’s RAM memory in detail.
Ribbon bar – basic buttons
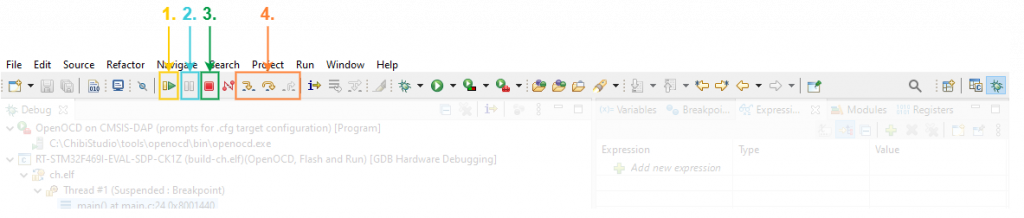
Some of the most used buttons brought forward in the Debug perspective are highlighted in the figure below:
- The Resume button resumes the code execution. If it appears in bright green color, it means that the project is not currently running and needs to be pressed to start the code execution.
- The Pause button pauses the code execution without ending the debug session. The Resume and Pause buttons are often used in conjunction and they are complementary.
- The Stop button terminates the current code execution session and ends the debug session. Unlike the Pause button, which allows the code to be resumed, the Stop button does not allow this: if the execution is stopped the debugging session needs to be restarted.
- The Step buttons are a collection of buttons that allow for partial or step-by-step execution of the code as limited by the breakpoints placed in the script.
First Launch
Upon initial launch, ChibiStudio displays a welcome window that can be closed without any harm. The C/C++ perspective should be the view that becomes visible, and the corresponding windows should be easily identifiable. If you are using ChibiStudio Preview 20 or higher, the default starting workspace is the user workspace, and Project Explorer should contain only the two default projects, representing the documentation and tools as mentioned in the earlier Project Explorer breakdown.
In conclusion, ChibiStudio offers a range of tools and perspectives for managing and debugging projects. Now that you have a clear overview of the toolchain, the suggested next article is Mastering multithreading with ChibiOS: a beginner’s guide where a default demo for the SDP-K1 will be analyzed in detail.
There’s no 2022 Chibi Studio for Linux?
Hello Antonio, you may wanna ask this one on ChibiOS Forum as I am not up to date with Linux’s releases